No invoice tells you what food waste costs. The costs are spread across purchasing, the kitchen, waste collection and care. In this worked example we set out, step by step, what food waste can cost a Dutch care organisation, with a formula you can check yourself and a source for every assumption.
What we know about the cost of food waste in healthcare
Recent figures are scarce, and most of what exists is about hospitals. A 2016 report by Wageningen University & Research (WUR) cites an earlier estimate that Dutch hospitals and care institutions together waste around 25% of the value of their food. For an average Dutch care institution, the report put the savings at around €200,000 a year (WUR, report 1637, 2016). The measurements in the same report came out even higher in value than that cautious 25%.
That research also found that about 40% (by weight) of the patient meals studied was thrown away, mostly from the hot meal. Dutch broadcaster NOS reported in 2017 that each hospital could save roughly €50,000 to €150,000 a year.
For nursing homes no such figures exist. In 2023 the Dutch minister confirmed there are no figures on food waste in care centres (parliamentary answers 2022-2023, no. 1345). So the numbers are old and not tailored to your organisation. Working it out yourself tells you more.
The formula: how to calculate the cost of food waste
You need four numbers: how many meals you serve per day, how many grams are thrown away per meal, what a kilo of food costs to buy, and how much CO₂ belongs to a kilo of wasted food. With those, you calculate in three steps.
- Kilos per year = meals per day × grams thrown away per meal × 365 ÷ 1,000
- Cost per year = kilos per year × purchase price per kilo
- CO₂ per year = kilos per year × kg CO₂-equivalent per kilo
To see what an improvement is worth, multiply the results by the percentage you throw away less.
A worked example with 300 meals a day
This is an example. It is not a sector average and not a measurement at a customer. We use the same default values as the calculator on our homepage, so you can see the result there and adjust it with your own numbers.
The inputs:
- 300 meals a day. Breakfast, lunch and dinner together, for instance for 100 residents or patients. Replace this with your own number.
- 150 grams thrown away per meal. An assumption for plate leftovers plus what's left in the kitchen, in serving dishes and in pans. There is no current national figure per meal for Dutch healthcare. This is exactly the number you are best placed to measure yourself.
- €8 per kilo. This is our own cautious assumption for the purchase value of wasted food, not a figure from research. For comparison, according to Rabobank (2023) the Dutch hospitality sector wastes over 55 million kilos of food a year, worth €647 million. That works out at roughly €11 to €12 per kilo.
- 3 kg CO₂-equivalent per kilo. The UK charity WRAP uses about 3 kg CO₂-equivalent per kilo of wasted food (WRAP, 2023). It is an average across all types of food.
The calculation:
- 300 × 150 grams × 365 ÷ 1,000 = 16,425 kilos a year
- 16,425 kilos × €8 = €131,400 a year
- 16,425 kilos × 3 = 49,275 kilos, or about 49 tons of CO₂-equivalent a year
Per meal, that is 150 grams × €8 per kilo = €1.20 of food in the bin.
Suppose that after you start measuring, you throw away 20% less. That saves 3,285 kilos, €26,280 and about 9.9 tons of CO₂-equivalent a year.
Two assumptions drive the result
The result leans heavily on grams per meal and price per kilo. A few variants, each with 300 meals a day:
- At 100 grams per meal: 10,950 kilos and €87,600 a year.
- At 200 grams per meal: 21,900 kilos and €175,200 a year.
- At 150 grams and €11.70 per kilo, roughly the hospitality average: just over €192,000 a year.
The gap between the lowest and highest variant is more than a factor of two. That is the limit of any worked example. It shows the order of magnitude, but your own business case only starts with your own measured grams.
Is 20% less realistic?
The 20% in the example is an assumption, not a promise. There are, however, international figures on what organisations achieved once they started measuring and acting.
Champions 12.3, a coalition working towards the UN goal of halving food waste, followed 86 catering sites in six countries, including hospitals and schools. On average, waste fell by 36% by weight in the first year, with a return on investment of 6 to 1 (Champions 12.3, 2018). Across 42 hotels in 15 countries, kitchen food waste fell by 21% on average in the first year, with a 7 to 1 return (Champions 12.3, 2018).
These are averages for food waste programmes in general. They say nothing about a specific product, ours included. They do show that 20% in the first year is not a bold assumption.
The costs that never show up on an invoice
The purchase value is the easiest to calculate, but it isn't the only cost. WUR advises including the cost of meal preparation and staff, to see the full spending on waste (WUR, report 1637, 2016).
- Labour. Food that is thrown away was also ordered, received, stored, prepared, distributed and cleared away. Those hours aren't in any purchase price.
- Energy and storage. Chilling, storing and reheating food that nobody eats costs energy. A guide for hospitality businesses from the Dutch Regio Foodvalley lists chilled storage and reheating among the often hidden costs of waste.
- Waste collection. The same guide puts the average cost of waste collection at €0.20 per kilo, though it varies by business and municipality. In the example that is just over €3,000 a year. Modest, but it adds up.
- Missed intake. In care, what comes back is also food that wasn't eaten. In 2024, 16.2% of Dutch nursing home residents had (a risk of) malnutrition, according to the LPZ, the national prevalence measurement of care problems (Goërtz et al., 2026). In 2016 WUR, based on older studies, put the extra healthcare cost of malnutrition in the Netherlands at €1.9 billion.
- Climate and commitments. Every kilo less counts towards requirement 7.3 of the Milieuthermometer Zorg, the Dutch environmental certification for care organisations, and towards the Green Deal Duurzame Zorg, the Dutch care sector's sustainability agreement (version 3.0, succeeded from 1 November 2026 by the 2027-2030 deal "Samen verder"). Read more in Green Deal Duurzame Zorg: what it asks about food waste.
One thing about that missed intake up front: less waste must never mean that residents or patients get less. The Dutch National Institute for Public Health and the Environment (RIVM) shows that measures such as more choice, easier ordering and extra help at mealtimes reduce waste and improve intake. The goal is the right amount and the right dish. More on that in Plate waste is a care signal: food waste and malnutrition.
From worked example to your own business case
A worked example opens the conversation with the board. A business case needs your own numbers. Here is how to get them:
- Count your meals. Take the number of meals served per day from your kitchen or ordering system, per location.
- Measure the grams. Do a baseline measurement of at least two weeks, across all wards and meal moments. See Food waste baseline measurement: a step-by-step plan for care.
- Use your real purchase price. Divide your annual food spend by the kilos purchased. Then you know what a kilo costs you.
- Calculate with a cautious improvement. Pick a percentage your board finds credible, and show that it sits below the international averages.
- Measure again. Only after a second measurement do you know what it really delivered.
Want to try it straight away? On the homepage you can run the same formula with your own numbers. The wider story is in Food waste in healthcare: what it costs and how to measure it.
How Waste Warrior Monitor supplies the missing number
The weakest link in any worked example is the number of grams per meal. That is exactly the number Waste Warrior Monitor supplies. After the meal, staff use the app to photograph what comes back: plates, serving dishes and pans. The AI estimates how many grams are on each photo and which ingredients they are, and staff can correct each ingredient. Drinks and other leftovers you enter yourself in grams.
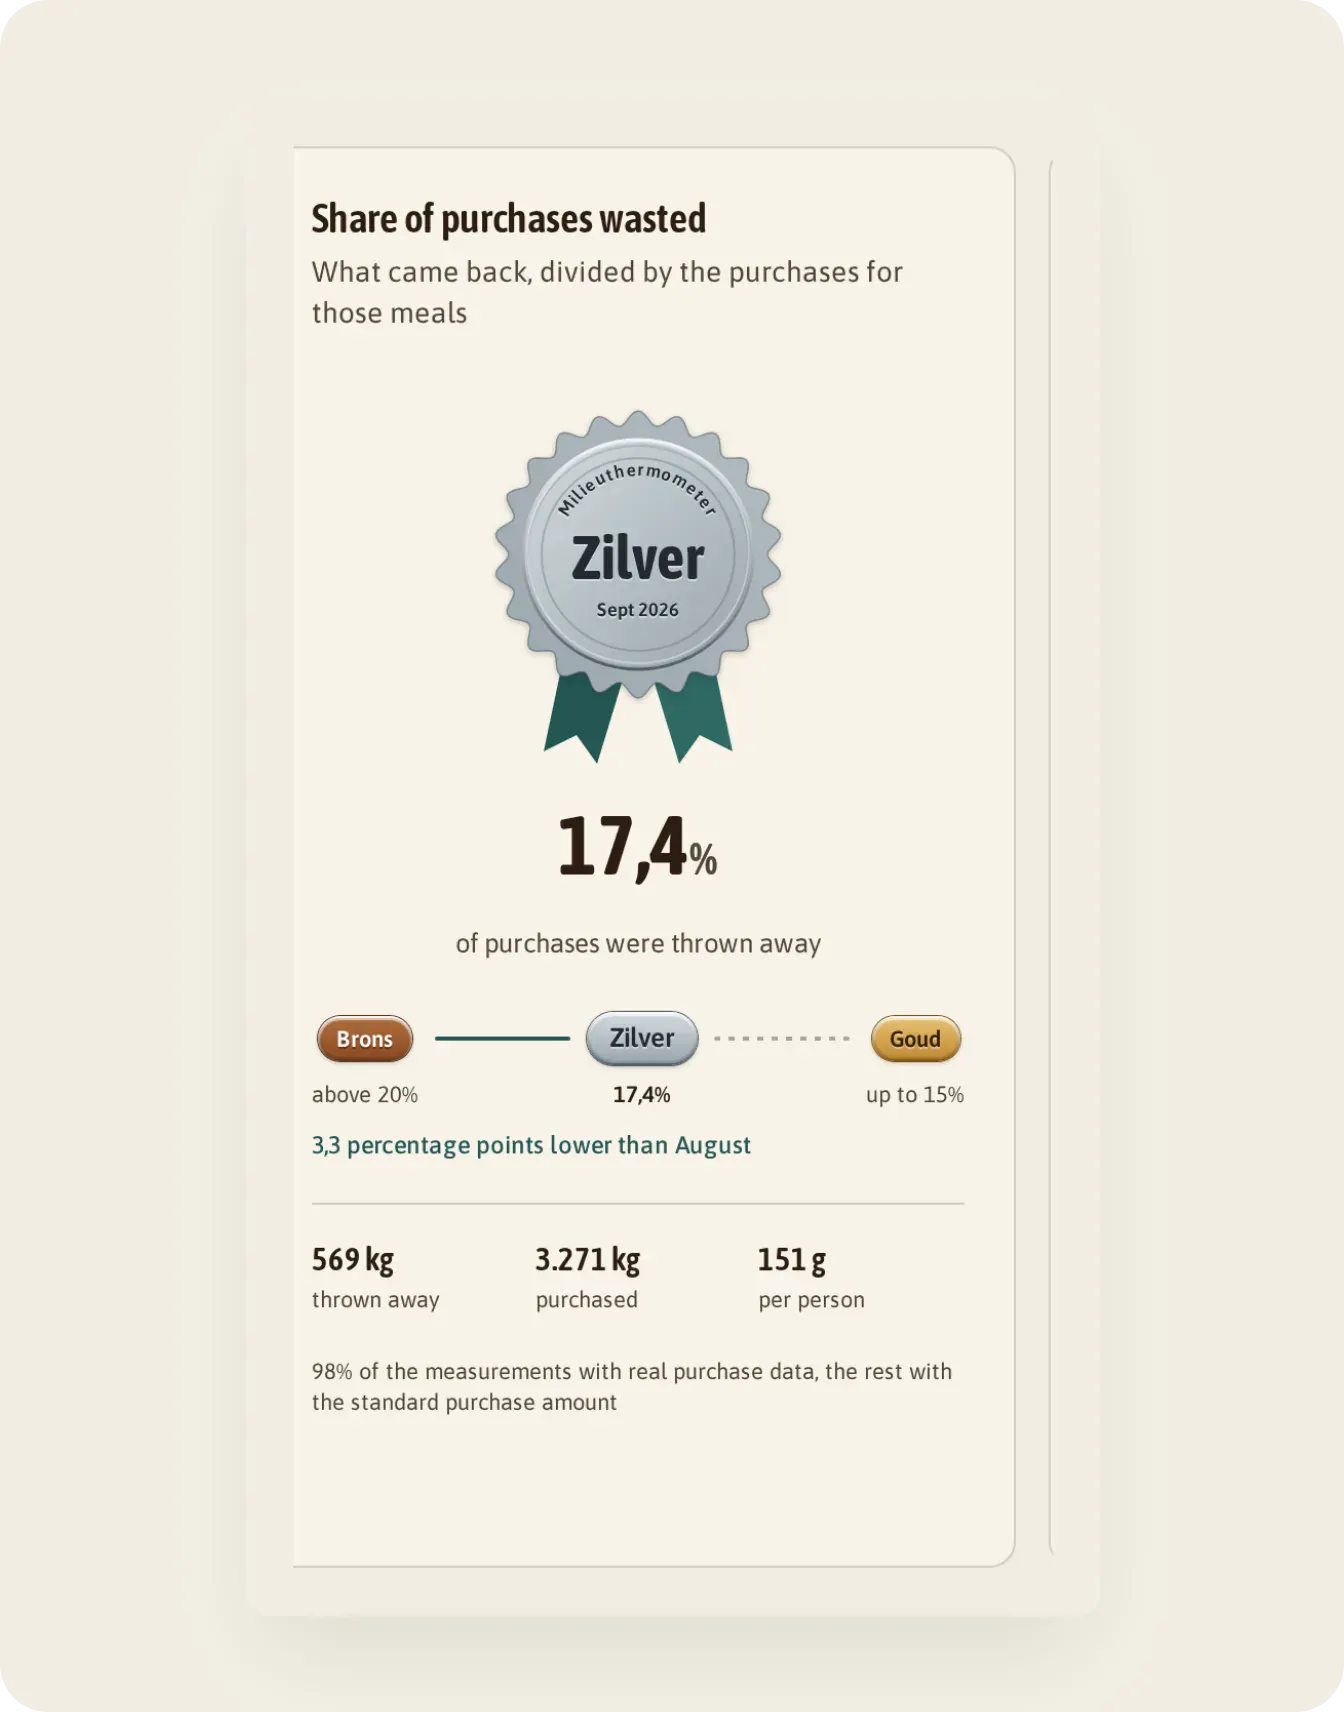
The dashboard shows how many kilos were thrown away, how many grams per person and what percentage of purchases, per ward and per meal moment. You link purchases with a scanned delivery note or through bulk purchase import (CSV import). Waste Warrior Monitor does not calculate euros or CO₂: you do that yourself, with the formula above and your own purchase price. That keeps your business case grounded in what really comes back in your organisation, and after every measure you can see whether the kilos go down.
Want to work it out together with your own numbers? Try the calculator or book a demo.