Food waste in healthcare costs money, adds to emissions and sometimes tells you something about how a patient or resident is doing. Yet hardly any Dutch care organisation knows exactly how much food goes in the bin, where and why. This guide sets out what the numbers do and don't say, what the Milieuthermometer Zorg and the Green Deal ask of you, and how to start measuring yourself.
What is food waste in healthcare?
Food waste is food that was meant to be eaten and still ends up in the bin. In a care organisation that happens in more places than the plate. Follow the food through the building and you find four points where it can go wrong.
- Purchasing and storage. More is ordered than needed, or products pass their date.
- Kitchen and portioning. More is cooked than is served. What stays in the pan often can't be reused.
- The ward. Serving dishes and pans come back half full, or a meal is never served because someone has gone home or wasn't hungry.
- The plate. What a resident or patient leaves.
A worked example in the WUR report Voedselverspilling in Nederlandse ziekenhuizen (Wageningen University & Research, 2016) shows how that split can look. In a hospital with a traditional meal system, 356 grams per patient per day was lost: 73 grams during portioning, 121 grams as plate waste and 162 grams as meals that came back untouched. Plate waste was less than half of the problem.
The Milieuthermometer Zorg works with three categories: kitchen waste (keukenafval), plate waste (bordenafval) and banqueting, the food and drink served at meetings and events. Stick to that split. You will be assessed on it later.
What the numbers say, and what they don't
The figure everyone quotes is 40%. It pays to know where it comes from. WUR research in Dutch hospitals found that of around 300,000 patient meals studied, about 40% (by weight) was thrown away, mostly from the hot meal. Vegetables were thrown away most often (WUR, 2016).
Dutch public broadcaster NOS reported the findings in January 2017. In hospitals that still cooked the traditional way, more than 40% of hot meals went in the bin, it said. Hospitals with a more modern concept, where patients order later and from more dishes, wasted nearly half as much.
What this figure is not:
- Not a current figure. The measurements run from 2010 to 2016. Many hospitals have changed their meal systems since.
- Not a figure for elderly care. It is about hospitals. For nursing homes, mental health care (GGZ) and disability care there is no comparable national number.
That last point is on the record. Answering parliamentary questions in 2023, the Dutch minister for long-term care wrote: "There are no figures on the amount of food waste in care centres" (Aanhangsel Handelingen 2022-2023, no. 1345, our translation). The national food waste monitor has no breakdown for the care sector.
For your organisation the lesson is simple. The only way to get a reliable figure for your own waste is to measure it yourself.
Why so much is left over in care
Waste in care has different causes than in a restaurant. You cook for people who are ill, have little appetite or follow a diet, and who often don't decide when they eat. The WUR report describes a few patterns in hospitals.
- Ordering long before the meal. In many hospitals a patient chooses early in the morning, or even the day before, what they will eat in the evening. The bigger that gap, the less likely the choice still matches how they feel.
- Portioning. Where food is still served out in the kitchen or on the ward, nearly half of the waste arises at that moment. No two scoops of potatoes or vegetables weigh the same.
- Little choice. With two or three options per component, the chance that there's something the patient really fancies is smaller.
- Thursdays and Fridays. Most meals came back on those days. WUR gives the example of patients being sent home unannounced on a Friday.
In 2025 the RIVM, the Dutch National Institute for Public Health and the Environment, reviewed the research on patient food waste. The reasons it lists are little appetite, food whose look, taste or portion size doesn't appeal, and limited choice. For puréed meals, meant for people who struggle to chew or swallow, one pilot study in the report found the most leftovers.
There is less research on long-term care. Which cause weighs heaviest for you only becomes clear once you measure per meal and per ward.
Why it matters: cost, climate and malnutrition
Cost
Food that is thrown away has been bought, prepared, transported and then disposed of. According to NOS, a hospital could save around €50,000 to €150,000 a year in 2017 by wasting less. The 2016 WUR report puts the saving potential for an average Dutch care institution at around €200,000 a year. Both amounts are old and use prices from the time. Treat them as an order of magnitude, not as a budget.
Your own estimate takes three numbers: meals per day, the grams that come back and a price per kilo. In What does food waste cost a care organisation? A worked example we work through it step by step.
Climate
Food you throw away has already been grown, transported and cooked. WRAP works with about 3 kg CO₂-equivalent per kilo of wasted food. An example: if a site throws away 50 kilos a day, that's over 18,000 kilos a year, or an estimated 55 tons of CO₂-equivalent. That is a sum using an average, not a measurement.
The Green Deal Duurzame Zorg, the Dutch care sector's sustainability agreement, aims for 55% less direct CO₂ emissions by 2030 compared with 2018, and climate neutrality by 2050. The emissions from wasted food sit mostly in the supply chain and largely fall outside that target. Throwing away less does fit the waste target of the new Green Deal: 15% less waste by weight by the end of 2030 compared with 2024. There is a national goal as well. The Netherlands wants to halve food waste by 2030 compared with 2015. In 2023 total food waste was 17% lower than in 2015 (letter to parliament, 4 September 2025).
Malnutrition
In care, what comes back is more than waste. It is also food someone didn't eat. According to the LPZ, the Dutch national prevalence measurement of care problems, 16.2% of nursing home residents had (a risk of) malnutrition in 2024, almost the same as in 2017 (Goërtz et al., Tijdschrift voor Gerontologie en Geriatrie, 2026).
That is why throwing away less is never the same as serving less. The goal is the right amount and the right dish. More on that in Plate waste is a care signal: food waste and malnutrition.
What the Milieuthermometer Zorg and the Green Deal ask
Two frameworks set the expectations for most Dutch care organisations.
The Green Deal Duurzame Zorg was signed in November 2022 as version 3.0. From 1 November 2026 it is succeeded by the 2027-2030 deal "Samen verder". Both versions contain the same agreement on food, word for word: "Care providers map their existing food waste and make every effort to reduce it as much as possible. At locations where clients and carers cook for themselves, the focus is on information and awareness" (Green Deal C-238, art. 5(2)(j), our translation). It sets no percentage.
The Milieuthermometer Zorg, the Dutch environmental certification for care organisations, makes it concrete. Requirement 7.1 asks for a sustainable food and catering plan with a baseline measurement (nulmeting) and measurable goals, including for food waste. Requirement 7.3 asks you to measure and record kitchen waste, plate waste and banqueting at least once a year. Within two years of certification, waste may be at most 20% of purchased weight. For gold, prepared meals may additionally be at most 15% (Milieuplatform Zorgsector (MPZ)). Requirement 7.3 is mandatory for silver and gold.
How to calculate that 20% and what an auditor looks at is covered in Milieuthermometer Zorg: how to measure food waste for requirement 7.3. What the new Green Deal asks beyond that is in Green Deal Duurzame Zorg: what it asks about food waste.
What works: lessons from practice
Waste can come down a lot, and patients' intake often improves along the way. In the same report the RIVM names three measures that do both:
- giving patients more choice in what and when they eat;
- making ordering easier, for example electronically at the bedside;
- extra nutrition assistance with choosing and eating.
Several smaller portions also reduce waste, but they can lower energy intake. Add energy-rich portions or extra snacks if you go that way.
Four examples show what that delivers.
- Radboudumc has nutrition assistants offer small dishes at the bedside in up to seven rounds, stocks ward kitchens by bed occupancy and uses as much as possible in the kitchen. Waste went from 35% to 11%. Patients' protein and energy intake went up (RIVM; Dijxhoorn et al., 2018).
- Ziekenhuis Gelderse Vallei dropped fixed mealtimes, varied portion sizes and made ordering possible at any time. Waste fell by a third (RIVM).
- Ziekenhuis Geel (Belgium) photographed the plates that came back and weighed the leftovers. Only two of the three scoops of mash were eaten, so the portion went down to two. Beetroot came back so often that it was taken off the menu. Over two years the kitchen matched every dish more closely to demand, and waste fell from 712 kilos a month in 2023 to 289 kilos in 2025 (VRT NWS).
- AZ Sint-Maria Halle (Belgium) measured for two weeks in October 2024 and again in 2025. Patients said in advance whether they wanted one portion or more, the kitchen revised its less popular menus, and meals were cancelled as soon as the kitchen knew a patient was being discharged. Waste was 23% lower (VRT NWS).
The pattern is the same every time: measure first, then change the system. Not just the serving spoon. These cases are covered in more detail in Food waste in hospitals: what works in practice.
Food waste by care sector
Hospitals
Most of what we know is about hospitals. Part of the waste is meals that come back untouched, for example because a patient went home unexpectedly (WUR, 2016). WUR also found that less is wasted the closer ordering is to the meal. That is the idea behind room service and free choice.
Nursing homes and elderly care (VVT)
In nursing homes people live for a long time, and the meal is a social moment. Food is often served at the table in the living room from serving dishes and pans. Waste then sits not only on the plate but also in what was never served. There are no national figures, so your own measurement is the starting point. Serving at the table and smaller portions with the option of seconds are discussed in Food waste in nursing homes: why elderly care is different.
Mental health and disability care
At some mental health (GGZ) and disability care locations, clients and carers cook for themselves in a residential group. The Green Deal names that situation separately and asks for information and awareness there. Requirement 7.3 of the Milieuthermometer only applies to central catering: a central kitchen cooking for more than 30 clients, or centrally purchased convenience meals. Decentralised cooking falls outside it. If your organisation also has a central kitchen, the measurement requirement does apply there.
Who needs to act
Food waste touches many people in an organisation, which makes it hard. The person who throws food away is rarely the person who buys it. Ward staff see the full plates, the kitchen sees the delivery notes, and the board only sees the annual accounts. An approach only works once those three connect.
- Board. Sets the goal, for example silver on the Milieuthermometer, and asks for a progress update a few times a year. Without that mandate it stays a project for one enthusiastic employee.
- Sustainability lead. Owns the measurement, the sustainable food and catering plan and the reporting. Is the contact for the auditor.
- Kitchen or head of catering. Manages purchasing and decides menus and portions. Most measures land here.
- Ward. Records what comes back. That has to fit into the work around the meal, or nobody keeps it up.
- Dietitian. Makes sure measures against waste don't put intake at risk.
Also agree how you report. A percentage of purchases per quarter, split by meal and ward, is easy for a board to follow and maps directly onto the Milieuthermometer standard.
Start with a baseline measurement
A baseline measurement (nulmeting) is your starting point: how much do you throw away now, where, and after which meal? Without that number you can't set a goal or show progress. Requirement 7.1 of the Milieuthermometer asks for it explicitly as well.
Five principles:
- Measure for long enough. MPZ advises at least two weeks, at different points in the process.
- Measure every stream. Kitchen waste, plate waste and what's left over from meetings. If you only measure plates, you often miss the largest part.
- Record purchases. The standard is a percentage of purchased weight. Without purchase data, all you have is kilos.
- Break it down. Per meal and per ward, so you can see where to start.
- Repeat. After the changes, measure again in the same way.
And four pitfalls:
- An unusual period. A week with bank holidays, a flu wave or a menu change gives a distorted picture. Choose weeks that look like a normal week.
- Only the hot meal. Breakfast, lunch and snacks count too, and sometimes there's more there than you expect.
- Kilos without purchases. 40 kilos on a ward with thirty residents is not the same as on a ward with ten. A percentage of purchases makes wards comparable.
- Leaving the ward out. Explain why you measure and what happens with the results. Staff who think they'll be judged on it measure less honestly.
The full plan is in Food waste baseline measurement: a step-by-step plan for care. Not sure about the method? Read Measuring food waste: scales, bin camera or a photo per plate?. What to do with the numbers afterwards is in Reducing food waste in care: what do you do with the figures?.
How Waste Warrior Monitor helps you measure in care
Waste Warrior Monitor is built to make that measurement doable without scales and forms on the ward. In the app, a staff member picks the ward, the meal and the number of people, and photographs what comes back: plates, serving dishes and pans. Empty plates don't need a photo. For each photo, the AI estimates how many grams are left and which ingredients are in it. If something is off, the staff member corrects the ingredient. Drinks and other leftovers are recorded too, with an estimated weight you enter yourself, so everything counts.
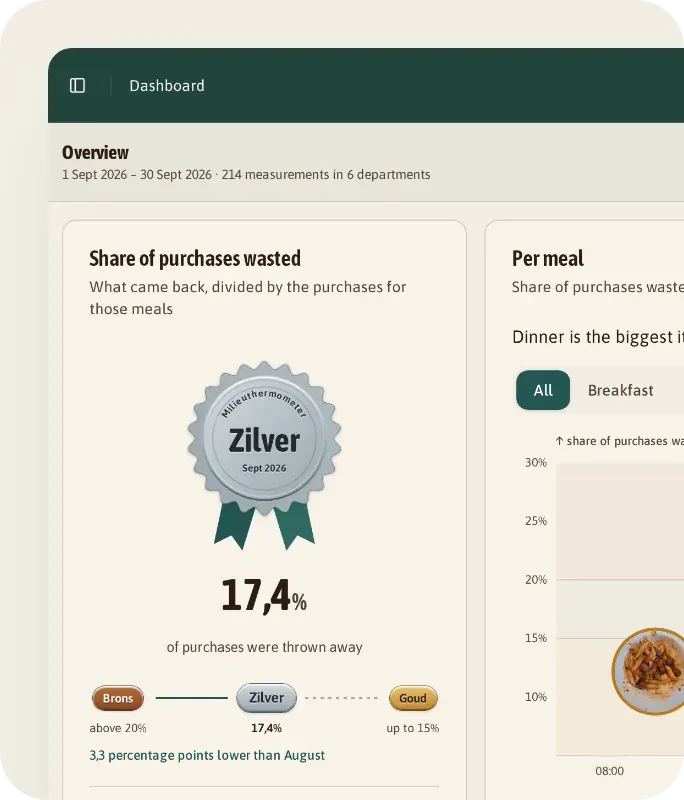
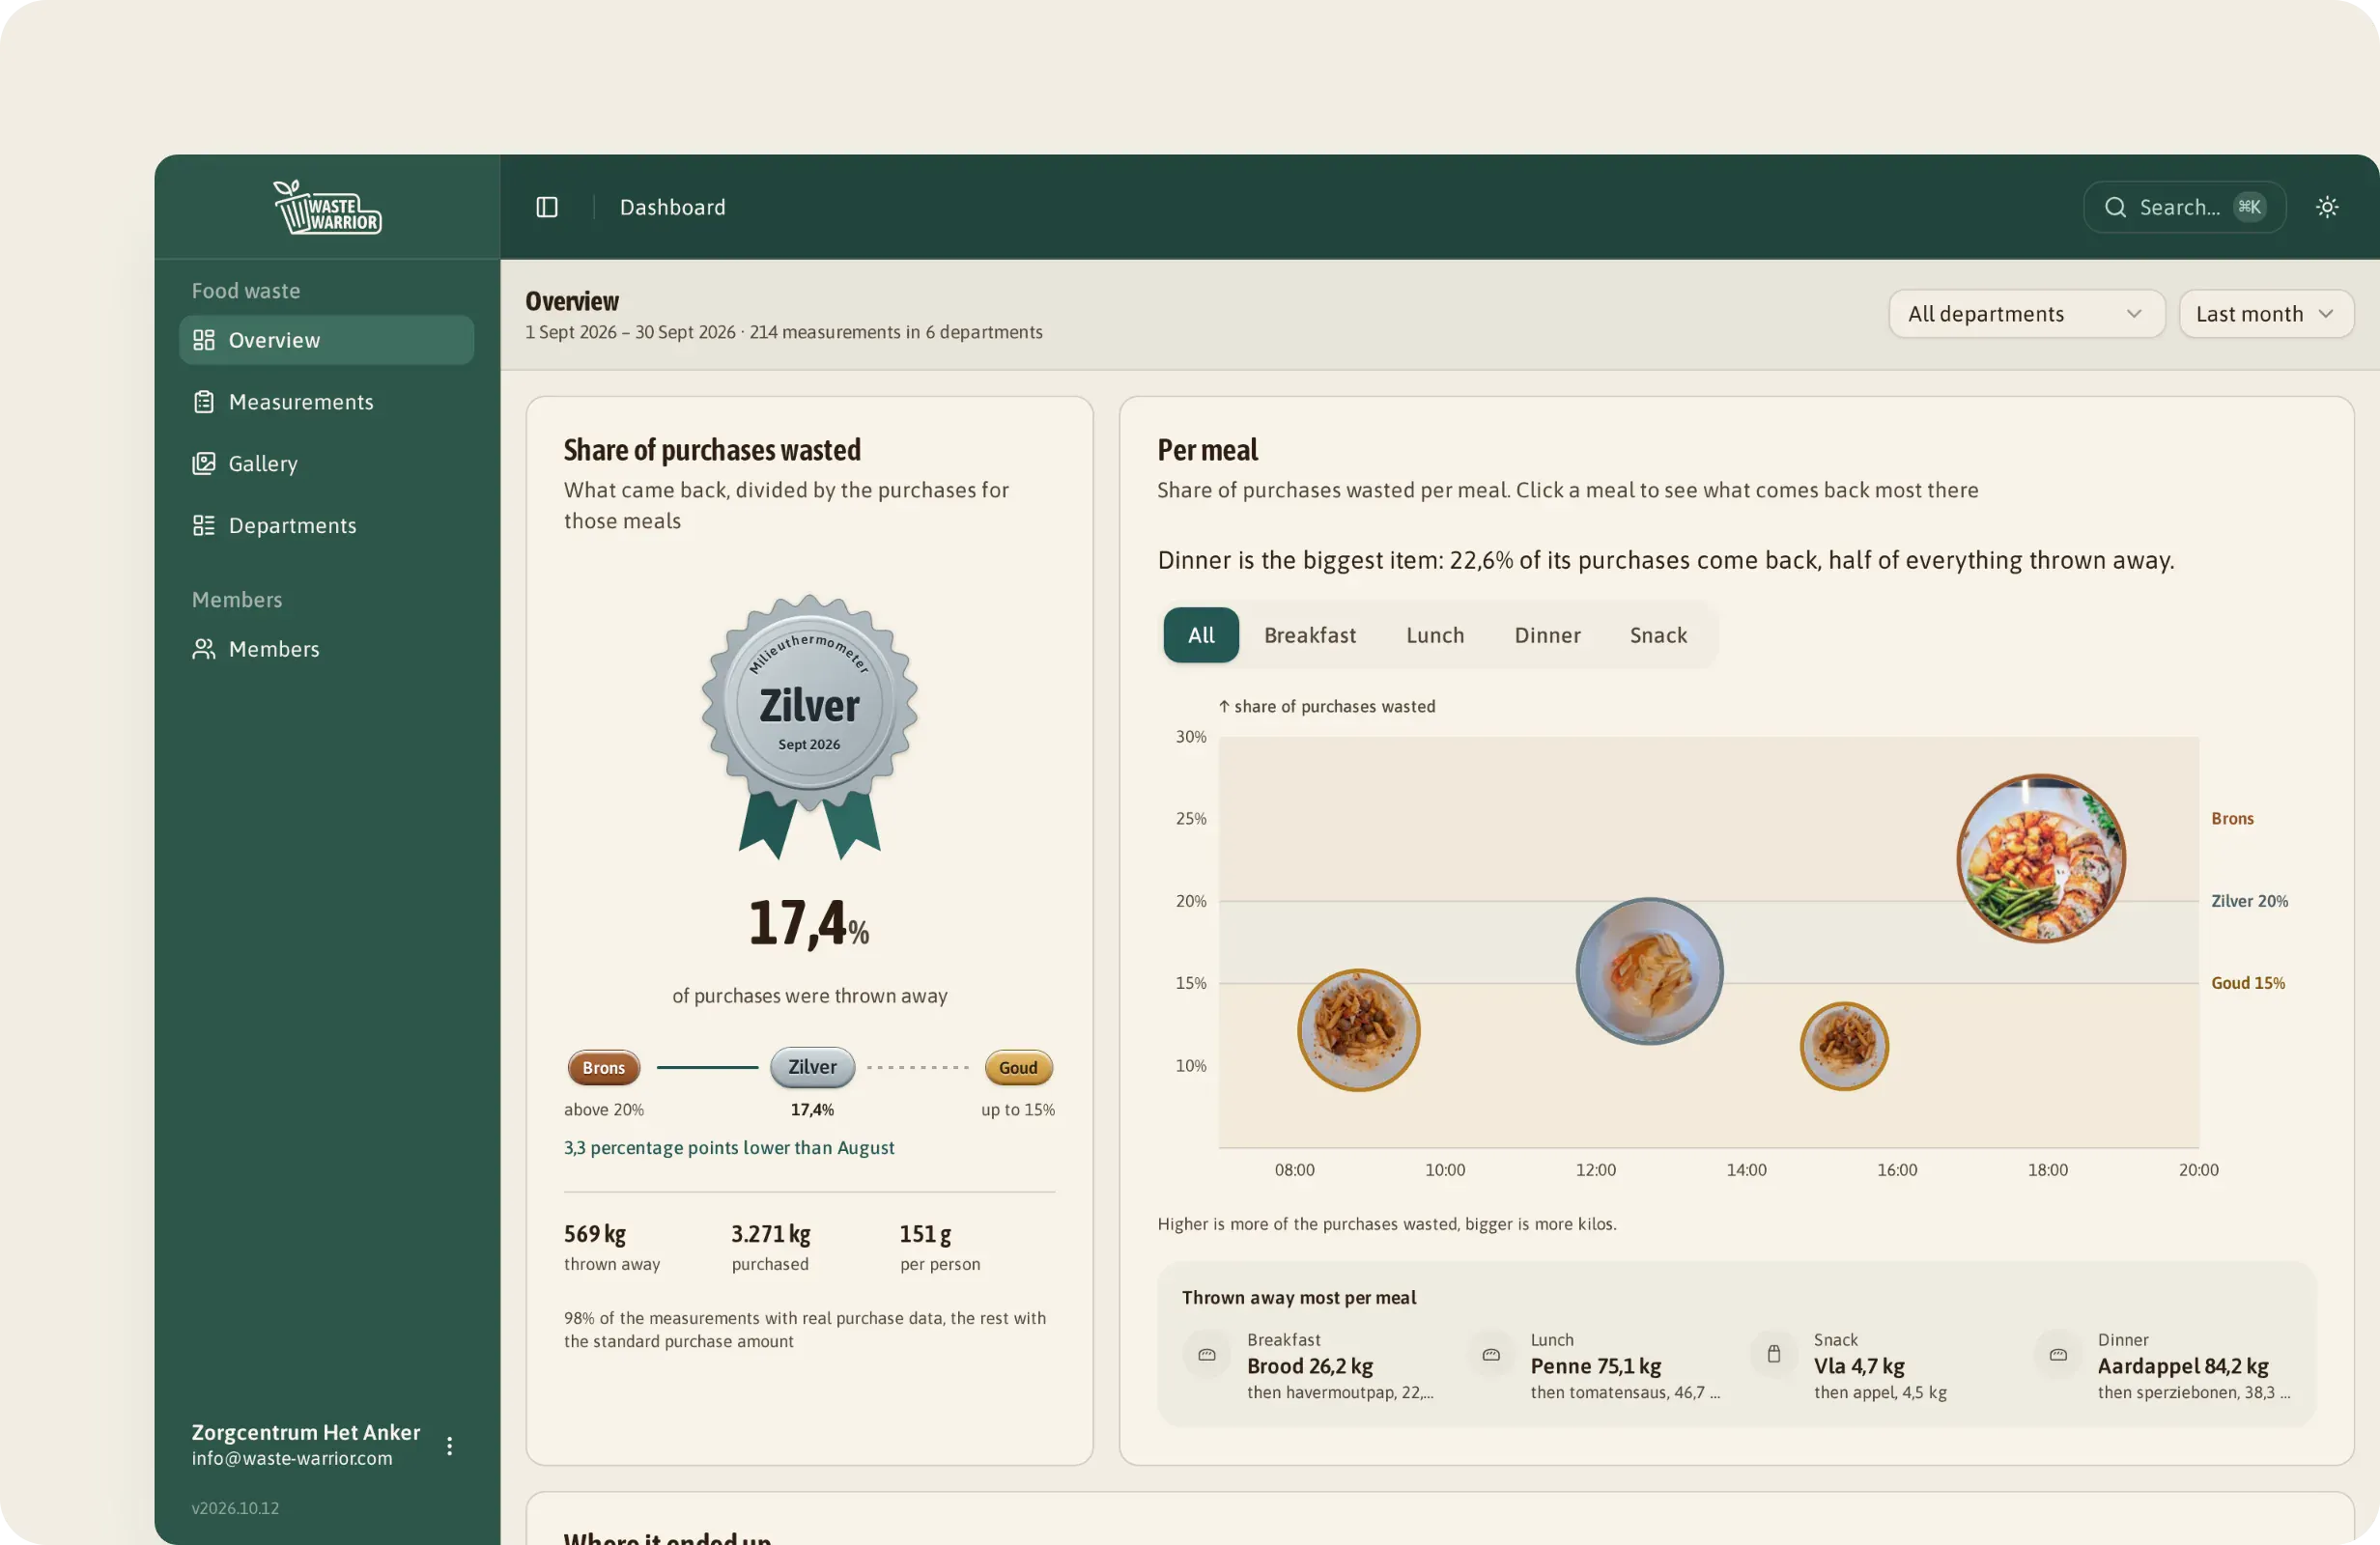
You link purchases by scanning a delivery note or through bulk purchase import (CSV import), for example from your supplier's export. The dashboard then shows waste as a percentage of purchases, the Milieuthermometer measure. You see it per meal, per ward and per ingredient, with the weekly trend and an overview of what's still missing. With automatic report generation (PDF report) you capture the figures for the board or the audit. All data stays in the EU.
Curious what that would look like for your organisation? Take a look at Waste Warrior Monitor or book a demo. Common questions are answered in the FAQ.