Food waste in restaurants is mostly a cost you don't see. The food disappears into a bin, and at the end of the month all you see is a high purchasing bill. What does waste cost the Dutch hospitality sector, where does the food go in a restaurant, and how do you start measuring without much hassle?
What food waste costs the hospitality sector
According to Rabobank, Dutch hospitality throws away more than 55 million kilos of food a year, worth €647 million (2023 figures). That was 9% less than in 2019, but still a sizeable sum. Roughly, that works out at €11 to €12 per kilo thrown away.
What does that mean for a single business? Suppose your restaurant throws away 10 kilos of food on an average day, counting peelings, spoiled products and plate leftovers together. At a cautious €11 per kilo, that is €110 a day. Over 300 opening days you reach €33,000 a year. Your own purchase prices and quantities will differ, so redo the sum with your own figures.
And that is only the purchase value. The work that goes into buying, storing, cutting and cooking comes on top.
Where the food goes: kitchen, fridge and plate
In a restaurant, most waste does not arise on the plate but in the kitchen and the fridge. UK figures from WRAP from 2013 show how it was split in hospitality and food service:
- 45% arose during preparation
- 34% came back on plates
- 21% was spoilage
These are older figures from another country, so use them as a direction, not a norm. Many chefs will recognise the picture: trimmings, leftover mise en place, products past their date. Plate leftovers are more visible, but rarely the whole story.
So for a good picture you follow three streams, not just what comes back from the table.
What the Food Waste Challenges show
"Less waste is mainly a matter of awareness, making small adjustments and measuring," said Jos Klerx of Rabobank in 2023. Practice bears that out.
- Rabobank's Food Waste Challenge. Almost a hundred hospitality businesses took part. The target was 12.5% less waste; the result was 21%, banken.nl reported in January 2020.
- Food Waste Challenge Amsterdam 2025. Eight organisations, including hotels and restaurants, measured daily for thirty days. Participants with comparable data achieved 27% less waste on average, according to Binnenlands Bestuur. One participant noticed that weekday guests caused proportionally more waste than weekend guests.
- Internationally. In a 2019 analysis by Champions 12.3 of 114 restaurants in 12 countries, every dollar invested in reducing kitchen food waste returned seven on average, and kitchen waste fell by 26% on average in the first year.
These are averages from supported programmes, not a guarantee for your business. The pattern is the same every time, though: whoever measures sees where the food goes, and whoever sees that starts doing things differently.
Measuring is not mandatory
There is no obligation to measure. Koninklijke Horeca Nederland (KHN), the Dutch hospitality trade association, says measuring can help businesses see where most waste occurs, but that it does not support a measurement obligation.
The EU did set binding targets in 2025: by 2030, waste in retail and consumption, which covers restaurants, food services and households, must jointly be 30% lower per capita than the 2021 to 2023 average. Those targets apply to Member States, not to your kitchen. They do make it likely that food waste in hospitality will get more attention.
How to start measuring food waste in your restaurant
It doesn't have to be perfect straight away. This simple setup works:
- Separate three streams. Kitchen waste (peelings and trimmings), fridge waste (past its date or spoiled) and plate waste (leftovers back from the table). A separate bin per stream makes it easy.
- Record each stream at a fixed moment. For example, the fridge around midday, kitchen waste after mise en place and plate leftovers after service. Fixed moments turn it into a habit.
- Weigh once a day. At the end of the day, put the bins on the scale and note the kilos per stream. That is your daily total.
- Link plate leftovers to dishes. Then you see per dish how much comes back.
- Measure for a few weeks before changing anything. Include busy and quiet days, weekdays and weekends. That stops one party night from shaping your picture.
- Discuss the figures with the team. Five minutes at the weekly briefing is enough.
Want to know which measurement method suits you, from scales and forms to a camera above the bin or a photo per plate, dish or pan? Read Measuring food waste: scales, bin camera or a photo per plate?.
What to do with the figures
After a few weeks you will see patterns. Some common ones, with what you can do about them:
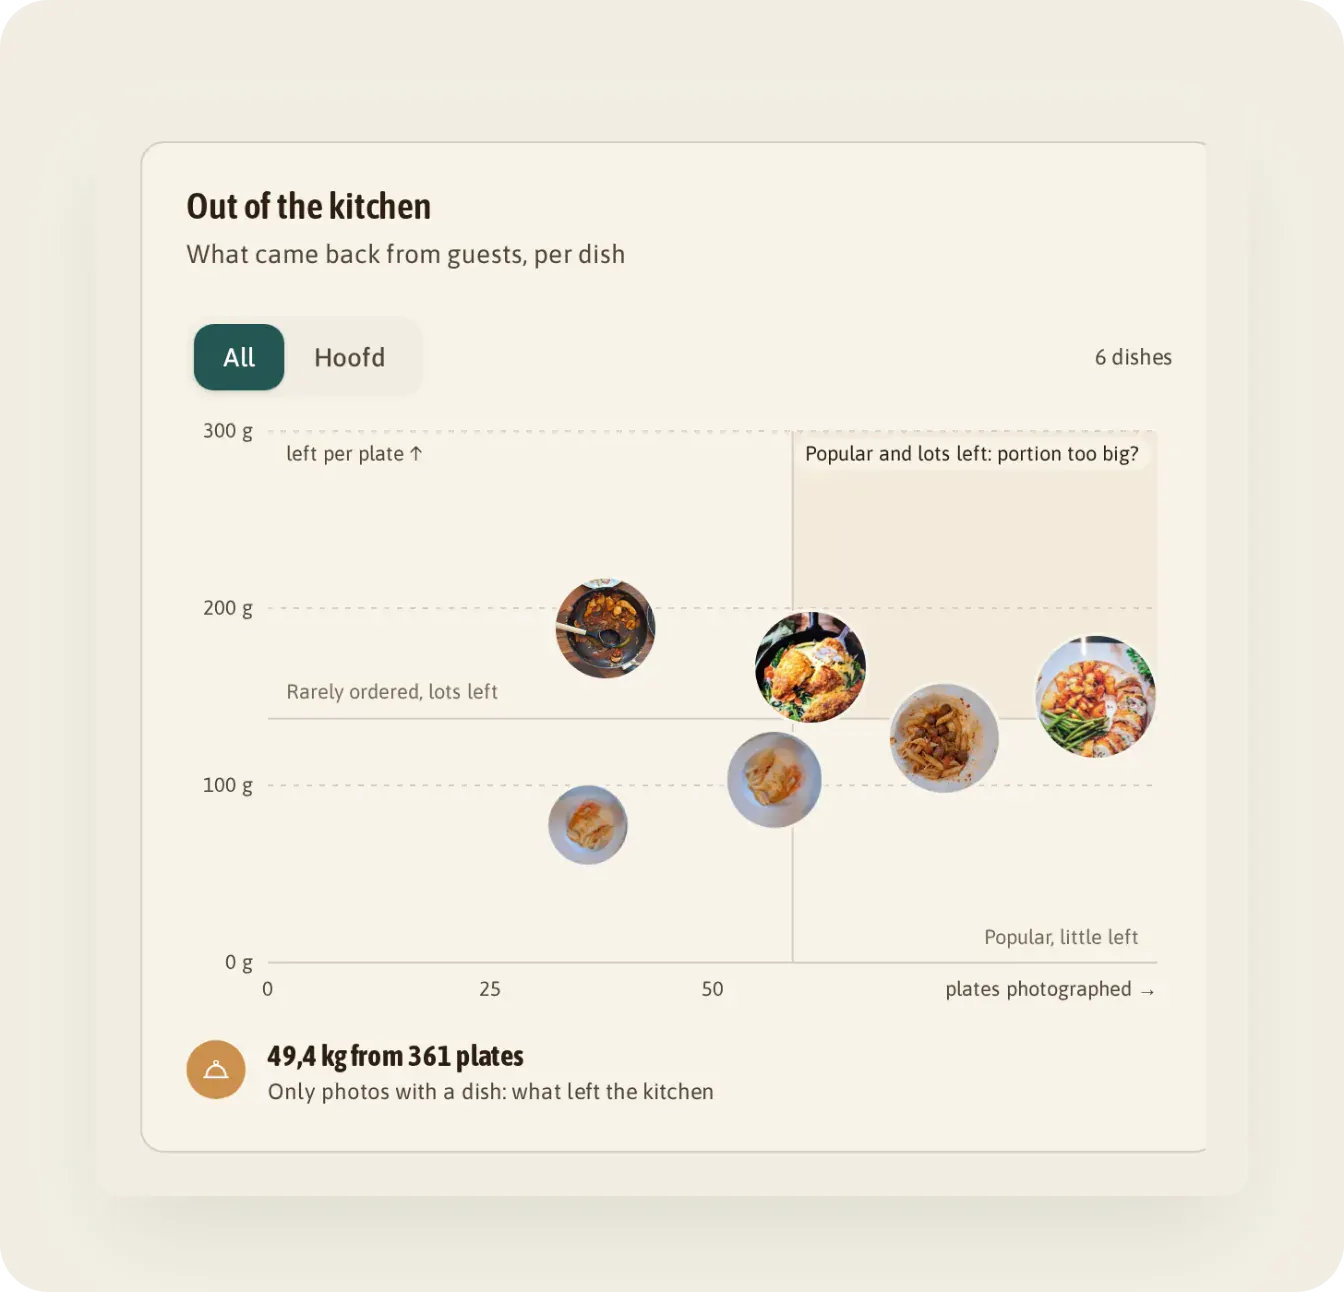
- A popular dish often comes back half eaten. The portion is probably too large, or a side is not being eaten. Make the portion smaller or serve the side on request.
- A dish is rarely ordered and leaves a lot behind. See whether it can come off the menu, or whether the recipe needs to change.
- A lot of fridge waste from a few products. Order smaller quantities more often, and stick more strictly to first in, first out.
- A lot of trimmings. Look at which trimmings can go into stock, sauces or staff meals, and how much mise en place you really need per day.
Change one thing at a time and keep measuring, so you see the effect. How to get from figures to measures is covered in Reducing food waste in care: what do you do with the figures?. That article is written for care, but the approach works in any kitchen. If you work in care, start with Food waste in healthcare: what it costs and how to measure it.
How Waste Warrior Monitor helps in your kitchen
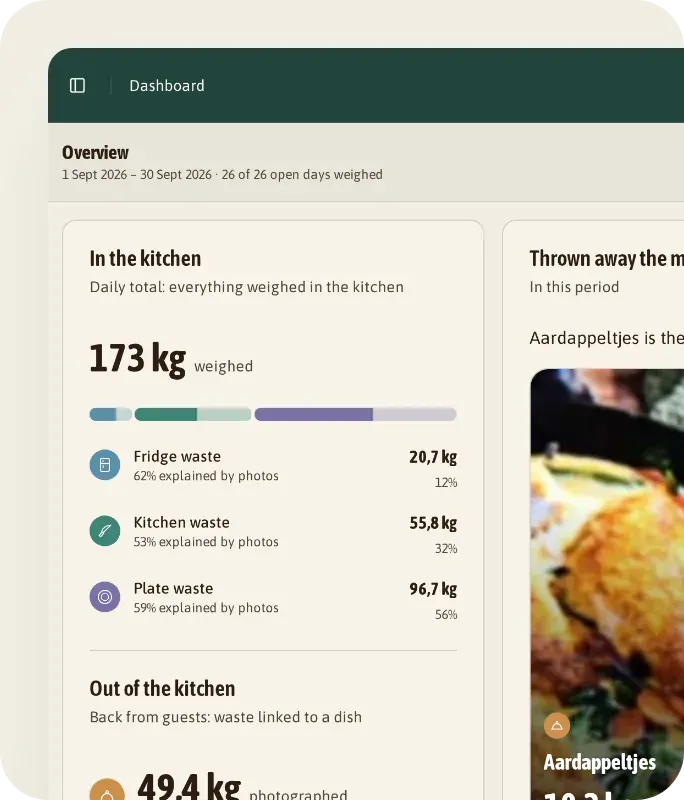
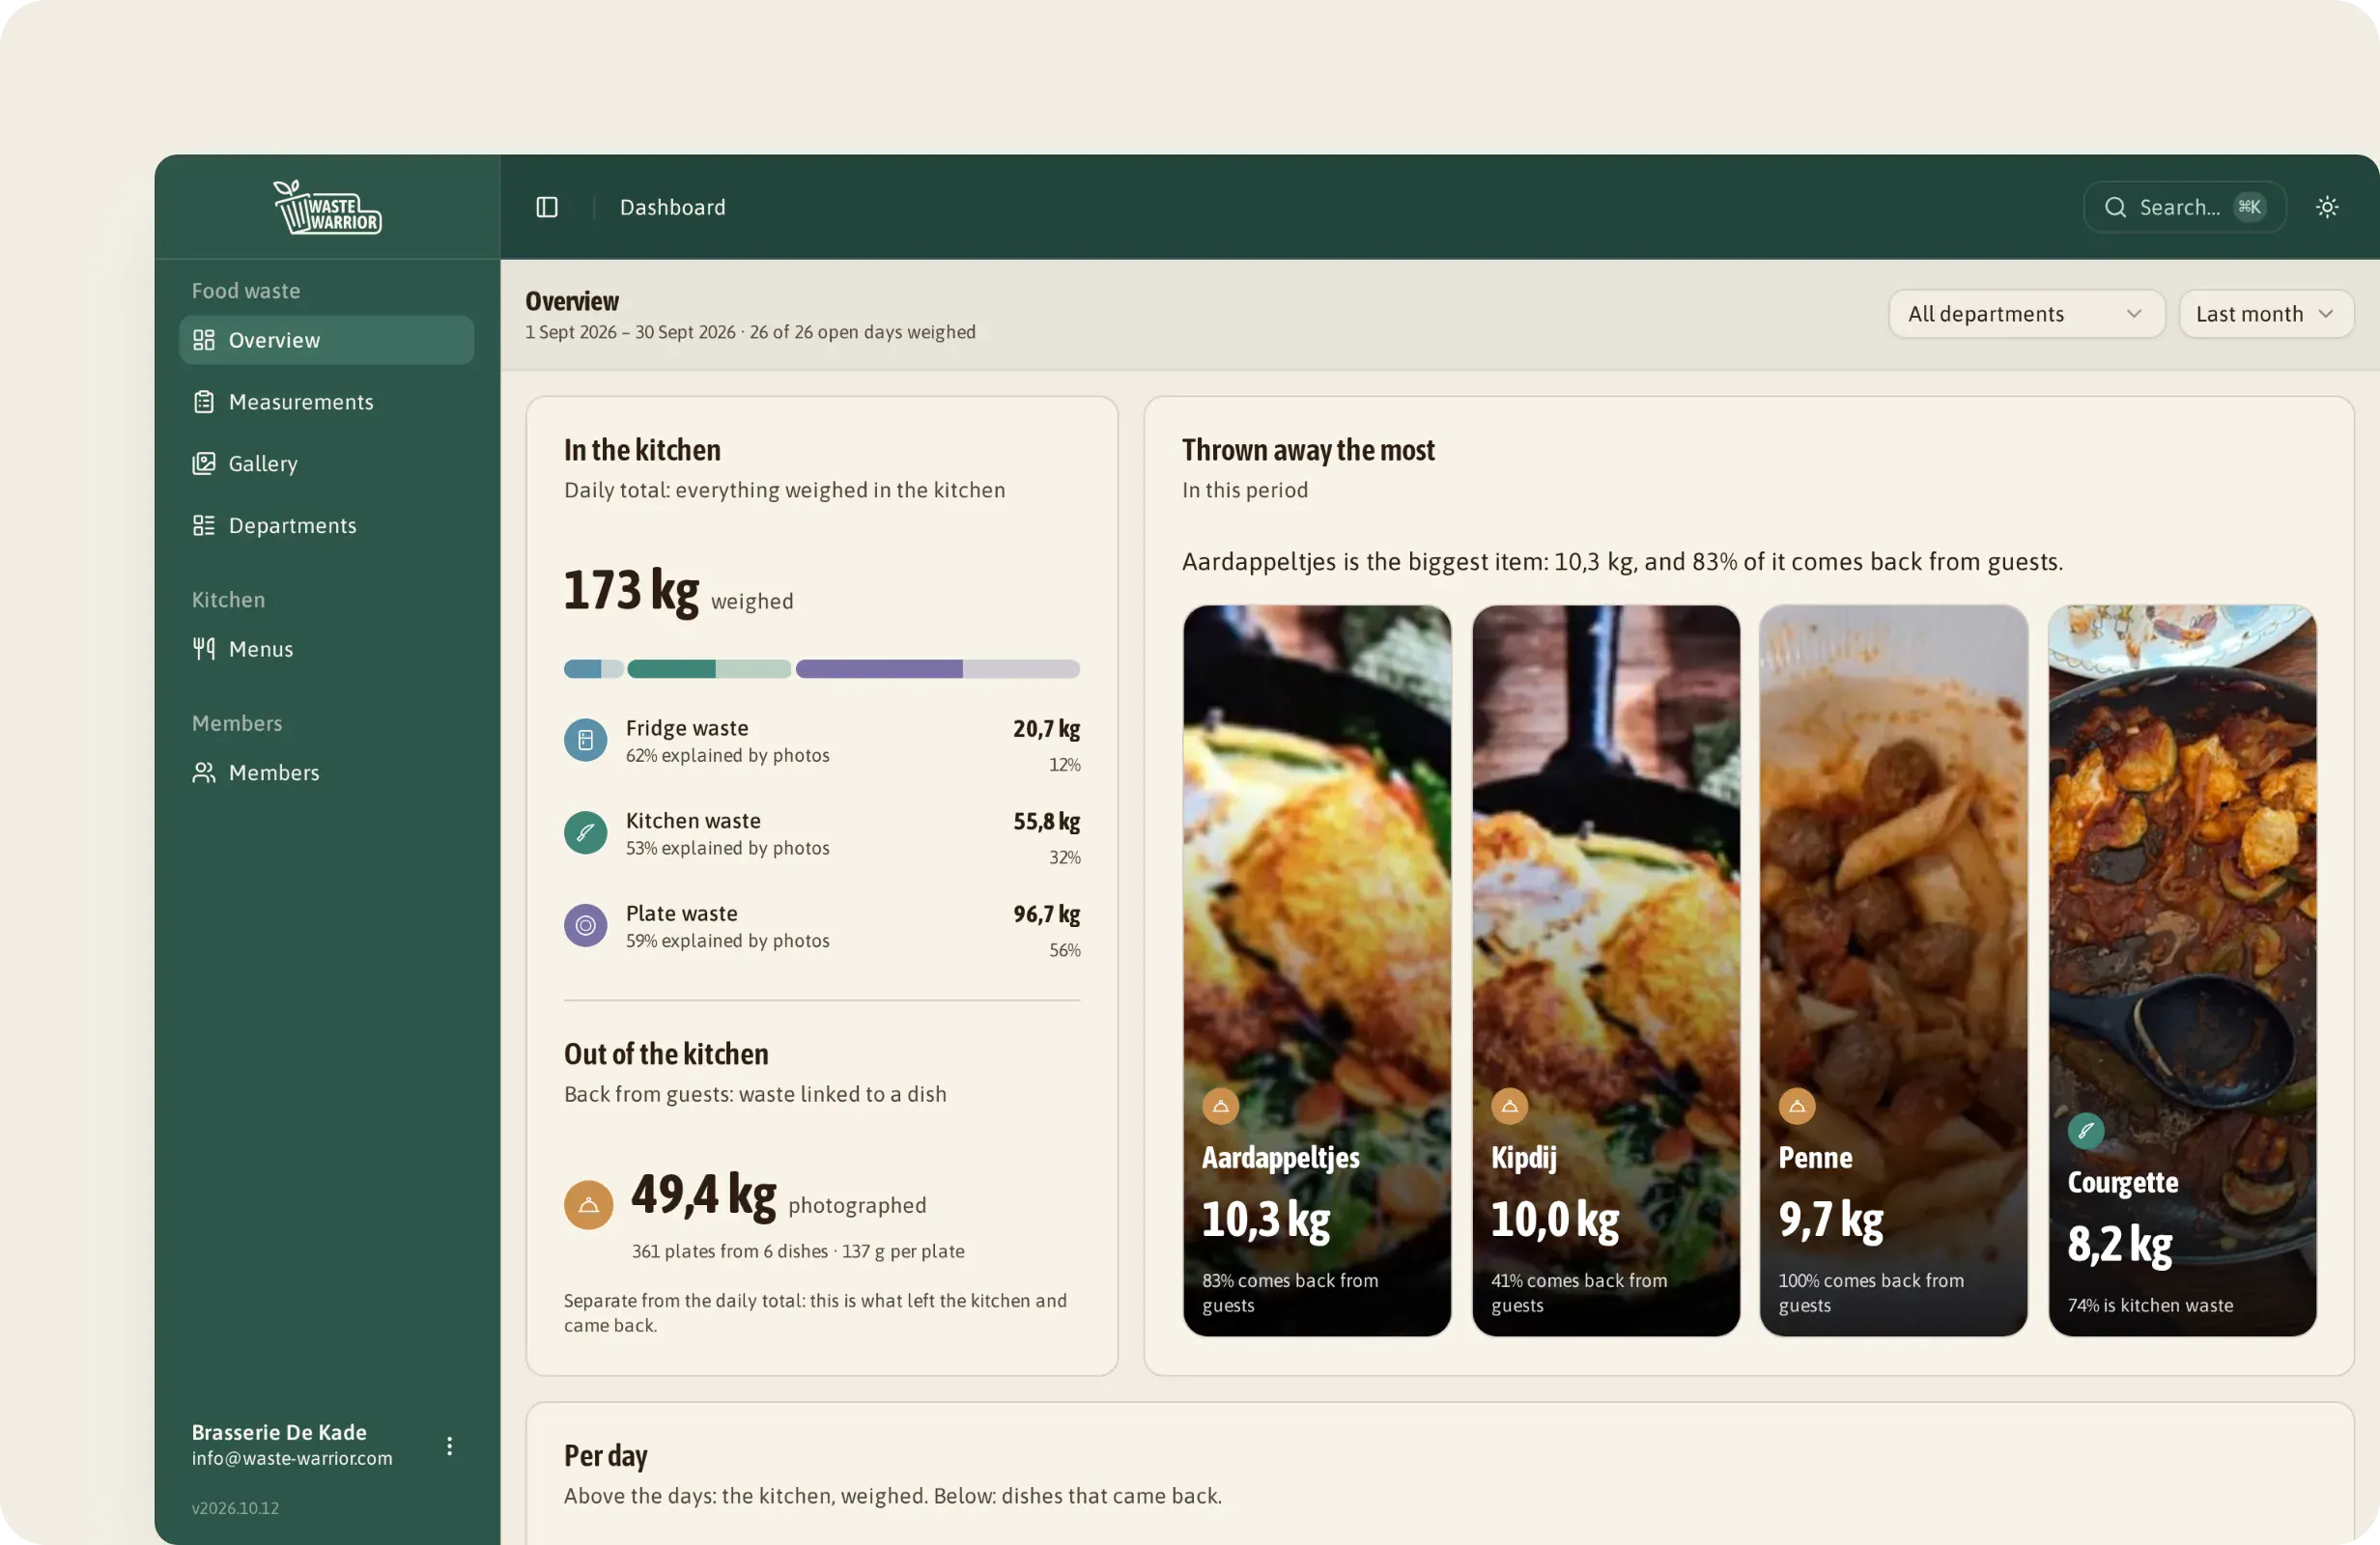
Waste Warrior Monitor has a restaurant variant that follows this setup. During the day your team photographs what is thrown away with a phone, and marks each photo as kitchen waste, fridge waste or plate waste. A plate photo can be linked to a dish on your menu. The AI estimates grams and ingredients per photo. Once a day you weigh the bins and enter the daily total per stream. If you like, the app can remind your team of those fixed moments.
The dashboard shows the weighed daily total next to how much of it the photos explain, per day and per week. You see which ingredients are thrown away most and where they are lost: in the fridge, in the kitchen or on the plate. For each dish you see how many plates came back and how much was left on average, with labels such as "popular and lots left over: portion too big?". "Wat ontbreekt" (what's missing) shows the days that were not weighed. The dashboard shows kilos; you work out the euros with your own purchase prices. The app is in Dutch; the dashboard is in Dutch and English.
Curious how that would work in your kitchen? Take a look at Waste Warrior Monitor or plan a demo.